Creating Protein Meshes in Graphein & 3D Visualisation#
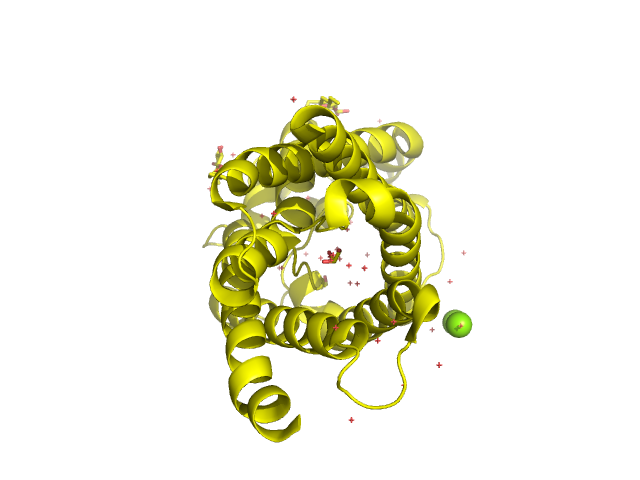
Graphein provides functionality to create meshes of protein surfaces. The mesh computation is handled under the hood by PyMol to produce .obj files, which are handled by many geometric analysis libraries (such as PyTorch3D). We’ll create a few protein meshes, convert them to PyTorch3D objects and visualise them. Again, there is a high-level and low-level API for convenience. We’ll be looking at PDB 1LDF, an elegant
structure of the E. col glycerol uptake facilitator protein.
![]()
NB lots of features of PyTorch3D are GPU only. If on macOS (only!), you can install via pip. Ensure you have PyTorch 1.9.0. This is the only supported configuration. See: https://github.com/facebookresearch/pytorch3d/blob/main/INSTALL.md
[1]:
# Install Graphein if necessary
# !pip install graphein

# Install pymol if necessary - in this tutorial PyMol is only used for the initial plot. Feel free to skip!
# sudo apt-get install pymol (recommended for colab) OR conda install -c schrodinger pymol
[2]:
# Install torch 1.9.0
# pip install torch==1.9.0

# Install pytorch3d
# pip install pytorch3d
[3]:
# NBVAL_SKIP
%matplotlib inline
import logging
logging.basicConfig(level=logging.CRITICAL)
High-level API#
Config#
Again, we use a ProteinMeshConfig config object to manage global configurations.
pymol_command_line_options: String of additional pymol command line options when launching. A full list can be found here. The default options,"-cKq", do:c: launch in command-line only mode for batch processingK: keep alive: when running without a GUI, don’t quit after the input is exhaustedq: supress startup message
pymol_commands: List of string pymol commands to execute. You can use these to configure the exact mesh you wish to construct. A reference to these can be found here
[4]:
from graphein.protein.config import ProteinMeshConfig
config = ProteinMeshConfig()
config.dict()
[4]:
{'pymol_command_line_options': '-cKq', 'pymol_commands': ['show surface']}
Building a mesh#
Let’s build a mesh!
[5]:
# NBVAL_SKIP
from graphein.protein.meshes import create_mesh

verts, faces, aux = create_mesh(pdb_code="1ldf", config=config)
print(verts, faces, aux)
A PyMOL RPC server is already running.
['show surface']
tensor([[ 18.2783, -11.1472,  -7.4127],
        [ 18.2783, -11.1472,  -7.4127],
        [ 18.2783, -11.1472,  -7.4127],
        ...,
        [ -9.5277, -18.5192,   0.2442],
        [ -9.5277, -18.5192,   0.2442],
        [-10.3366, -18.0868,  -0.5147]]) Faces(verts_idx=tensor([[   0,    1,    2],
        [   3,    4,    5],
        [   6,    8,    7],
        ...,
        [6516, 6518, 6517],
        [6519, 6521, 6520],
        [6522, 6524, 6523]]), normals_idx=tensor([[  -1,   -1,   -1],
        [  -1,   -1,   -1],
        [   0,    2,    1],
        ...,
        [6510, 6512, 6511],
        [6513, 6515, 6514],
        [6516, 6518, 6517]]), textures_idx=tensor([[-1, -1, -1],
        [-1, -1, -1],
        [-1, -1, -1],
        ...,
        [-1, -1, -1],
        [-1, -1, -1],
        [-1, -1, -1]]), materials_idx=tensor([-1, -1, -1,  ..., -1, -1, -1])) Properties(normals=tensor([[-0.6557, -0.6884, -0.3100],
        [-0.6557, -0.6884, -0.3100],
        [-0.6557, -0.6884, -0.3100],
        ...,
        [-0.4031, -0.9108, -0.0894],
        [-0.3856, -0.9160, -0.1110],
        [-0.3923, -0.9148, -0.0957]]), verts_uvs=None, material_colors=None, texture_images=None, texture_atlas=None)
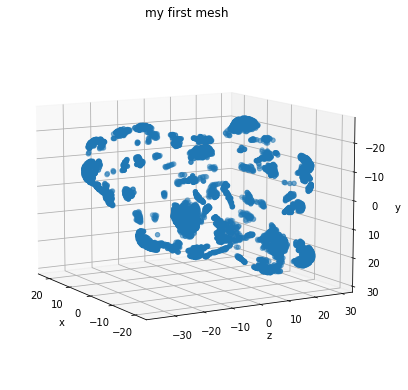
In order to visualise these tensors containing vertices, faces and aux data, we convert them into a PyTorch3D Mesh object
[6]:
# NBVAL_SKIP
from graphein.protein.meshes import convert_verts_and_face_to_mesh
m = convert_verts_and_face_to_mesh(verts, faces)

from graphein.protein.visualisation import plot_pointcloud
plot_pointcloud(m, title="my first mesh")
/Users/arianjamasb/github/graphein/graphein/protein/visualisation.py:63: MatplotlibDeprecationWarning: Axes3D(fig) adding itself to the figure is deprecated since 3.4. Pass the keyword argument auto_add_to_figure=False and use fig.add_axes(ax) to suppress this warning. The default value of auto_add_to_figure will change to False in mpl3.5 and True values will no longer work in 3.6.  This is consistent with other Axes classes.
  ax = Axes3D(fig)
[6]:
<Axes3D:title={'center':'my first mesh'}, xlabel='x', ylabel='z'>
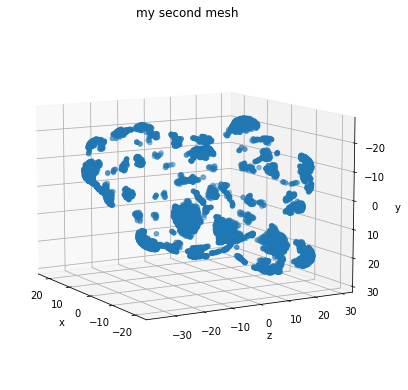
Modifying Mesh Parameters#
Let’s see what happens if we play around with some of the parameters and make a smoother mesh using
[7]:
# NBVAL_SKIP
pymol_commands = {"pymol_commands": ["hide cartoon",
                                     "set solvent_radius, 10",
                                     "alter all, vdw=4",
                                     "sort",
                                     "set surface_quality, 1",
                                     "show surface"]}

config = ProteinMeshConfig(**pymol_commands)

verts, faces, aux = create_mesh(pdb_code="1ldf", config=config)

m = convert_verts_and_face_to_mesh(verts, faces)

plot_pointcloud(m, title="my second mesh")
A PyMOL RPC server is already running.
['hide cartoon', 'set solvent_radius, 10', 'alter all, vdw=4', 'sort', 'set surface_quality, 1', 'show surface']
/Users/arianjamasb/github/graphein/graphein/protein/visualisation.py:63: MatplotlibDeprecationWarning: Axes3D(fig) adding itself to the figure is deprecated since 3.4. Pass the keyword argument auto_add_to_figure=False and use fig.add_axes(ax) to suppress this warning. The default value of auto_add_to_figure will change to False in mpl3.5 and True values will no longer work in 3.6.  This is consistent with other Axes classes.
  ax = Axes3D(fig)
[7]:
<Axes3D:title={'center':'my second mesh'}, xlabel='x', ylabel='z'>
Using PyMol for 3D Visualisation#
We also provide a wrapper for pymol (based on IPyMol developed by @cxhernandez)
[8]:
# NBVAL_SKIP
from graphein.utils.pymol import viewer as pymol
pymol.delete("all") # delete all objects from other sessions if necessary.
pymol.fetch("1ldf")
pymol.display()
[8]: